![]()
![]()
![]()
![]()
![]()
![]()
|
|
INTERNAL ACCOUNTING ENGINEERINGInternal Chart of AccountsGRAPHIC OF THE CHART OF ACCOUNTS
Exhibit 20 In analyzing the graphic of the Chart of Accounts - let us here study some important details.
This next Exhibit reveals some important details of the graphical structure.
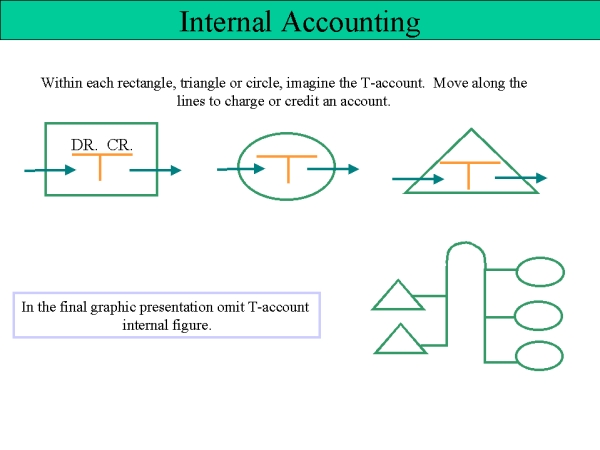
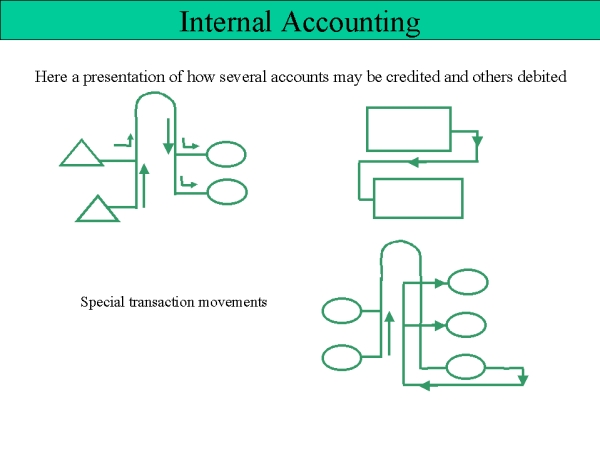
Exhibit 21 All Asset accounts will be represented in the graphic with a rectangle. All Liability accounts will have a triangle and all other accounts will be represented with a circle. Within each of this figures we may imagine a T-account. This type of presentation indicates that when an arrow line moves from left into the figure: an amount is transferred to the debit of this account. And if an arrow line moves out of the figure on the right hand side: and amount is transferred from this account. In this presentation a T is shown in the center of the figure. In the final graphic, this is not the case. The T account is replaced with the corresponding code of the account. Just indicating the Group and Main account of this account. The next Exhibit is showing us the pre-established movements of the values within this graphic presentation. The accounting transaction will always start from the Credit of an account - it moves from the right of the triangle, rectangle or circle to the debit of the corresponding account. In this graphic we see how amounts from the credit of some Liability accounts are transferred to the debit of Expenditure accounts. Or we credit some Asset account and transfer the amount to the debit of the next Asset account, or we credit some circle accounts and transfer the amounts to the debit of some other circle accounts. We may also observe, that movements of amounts from credit of some accounts go along the full line to the right, then up this line, then turn down and enter some account by moving to the right along this full line and into the debit of the corresponding figure. This is the basic rule of the movement of values within the graphic structure. Exception of this rule is when some Asset amount leaves from the credit of a rectangle to the debit of the some Asset or Liability account. Here our Exhibit 22:
Exhibit 22 On these full lines we observe some arrow heads - indicating the movement between the accounts.
ACCOUNTING CODE STRUCTUREIn this analysis, we will show you how we recommend to structure the accounting code:
This would be an Expenditure structure: 1-0-00-000 EXPENDITURE 1-1-00-000 SALARIES AND WAGES 1-1-01-000 Salaries 1-1-01-001 Management This is a simple 1-1-01-005 Engineers roll up system. 1-1-02-000 Wages 1-1-02-001 Direct Labor 1-1-02-005 Indirect Labor
This code structure should be used with all accounts. We should identify the following basic Class of Accounts: Class 0 = Assets and Liabilities Class 2 = Cost Elements Class 1 = Expenditure Class 3 and 4 = Departments Class 8 = Revenues Class 5 and 6 = Functional activities Class 7 = Cost of Goods Sold The detailed accounting structure you may study under: Requirements. |